How to find slow and duplicate queries in Laravel
When a Laravel page is slow because of the database, it is usually one of three things: a query that is slow on its own, the same query running more than once, or an N+1. Here is how to find the first two with Laravel's own tools, and how to see all three for every request at once.
Log every query that takes too long
DB::listen hands you each query with its bindings and its time in milliseconds. Log the
ones above a threshold:
In a service provider's boot methoduse Illuminate\Database\Events\QueryExecuted;
use Illuminate\Support\Facades\DB;
use Illuminate\Support\Facades\Log;

DB::listen(function (QueryExecuted $query) {
    if ($query->time > 100) {   // milliseconds
        Log::warning('Slow query', ['sql' => $query->sql, 'bindings' => $query->bindings, 'ms' => $query->time]);
    }
});
Some requests are slow without a single slow query: they just run a lot of them. Laravel can call you when one request spends too long in the database in total:
use Illuminate\Database\Connection;
use Illuminate\Database\Events\QueryExecuted;
use Illuminate\Support\Facades\DB;

DB::whenQueryingForLongerThan(500, function (Connection $connection, QueryExecuted $event) {
    // This request has spent more than 500 ms in the database in total.
});
Find out why a query is slow
Ask the database for its plan. The query builder runs EXPLAIN for you:
Order::where('status', 'shipped')->orderBy('created_at')->explain()->dd();Look for a full scan of a large table, and for columns you filter, join or sort by that have no index. Often the fix is a single index in a migration:
Schema::table('orders', function (Blueprint $table) {
    $table->index(['status', 'created_at']);
});
Catch duplicate queries
The same query, with the same bindings, running twice in one request usually means a value is
loaded in two places: a helper, a view composer, a policy, a middleware. Load it once and pass it
down, or let once() remember it for the rest of the request:
public function settings(): array
{
    return once(fn () => Setting::pluck('value', 'key')->all());
}
Many runs of one query with different bindings is a different pattern, the N+1: how to find and fix N+1 queries in Laravel.
See all of it, per request
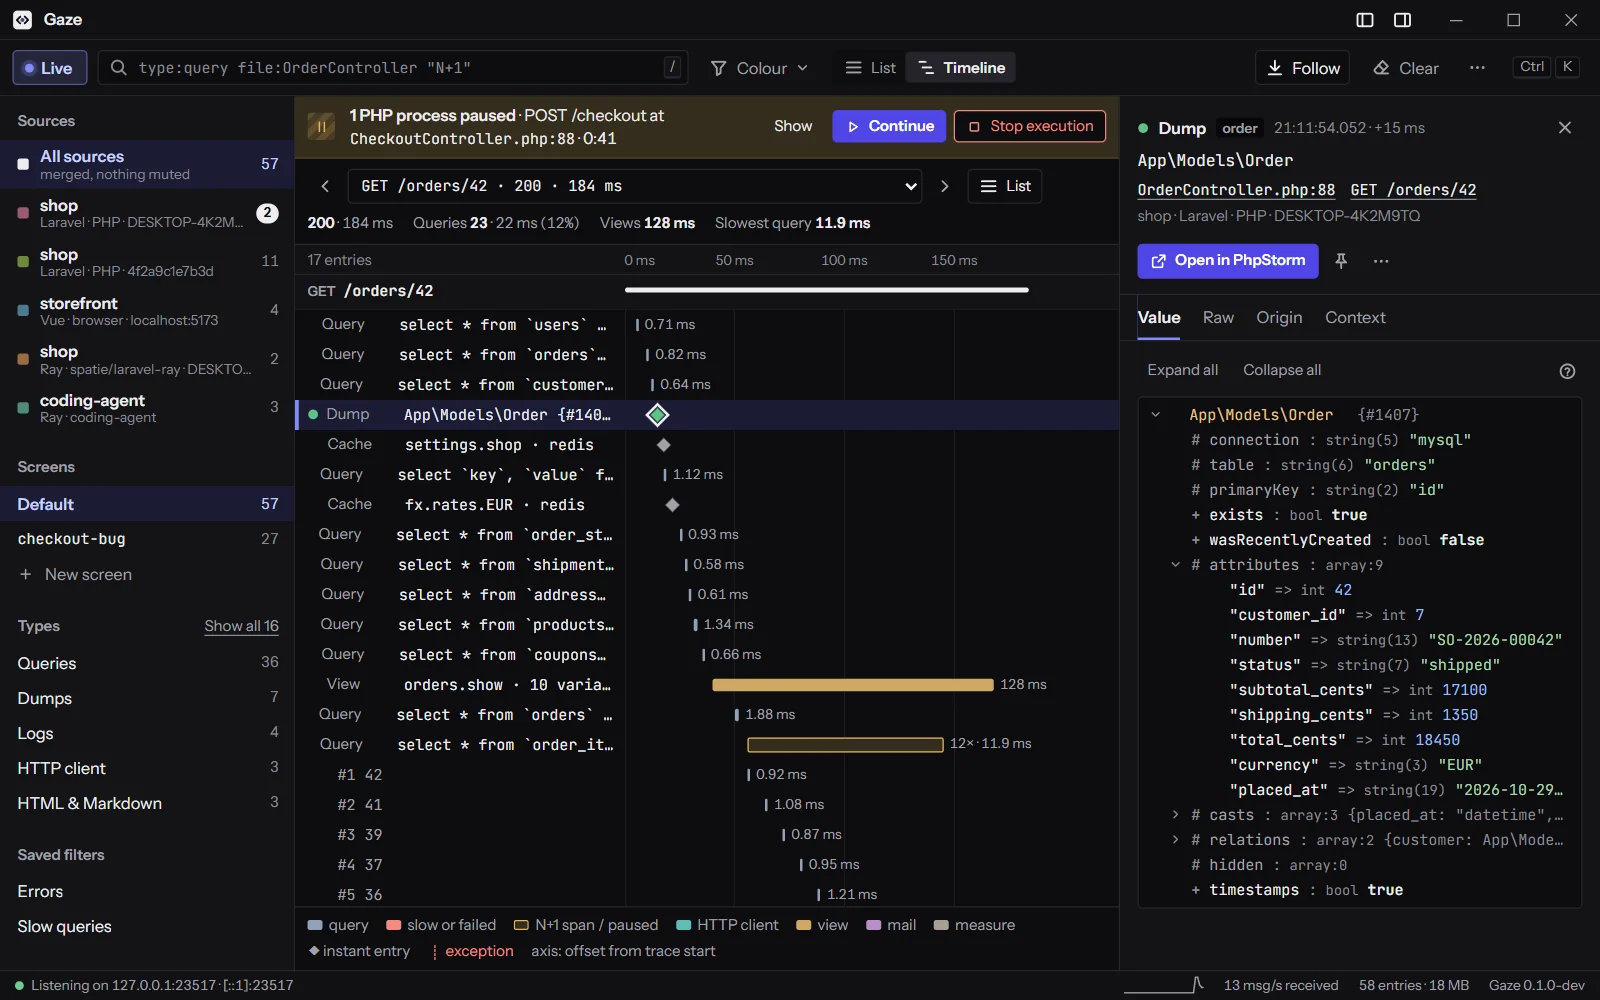
Gaze groups every query a request runs under that request, with the time each one
took and a summary on top. Queries above a threshold are marked slow (500 ms by default, changed
with GAZE_SLOW_QUERY_MS), repeats are counted as duplicates, and repeated query shapes fold
into an N+1 row. The timeline draws each query from when it started, so you see where the time
went at a glance.
->gaze() on a query builder shows the SQL with its bindings before it runs, and the query
inspector copies runnable SQL for EXPLAIN. If you would rather not see every query,
GAZE_SLOW_QUERIES and GAZE_DUPLICATE_QUERIES send only those. Still reaching for
dd() to look at results? See
how to debug Laravel without dd().
Questions
How do I log slow queries in Laravel?
Listen with DB::listen in a service provider and log any query whose time is above your threshold; $query->time is in milliseconds. For the total time a request spends in the database, use DB::whenQueryingForLongerThan.
What counts as a slow query?
It depends on the page, but a single query above 100 ms on a page that should answer in under a second is worth a look. Gaze marks queries above 500 ms by default, and GAZE_SLOW_QUERY_MS changes the threshold.
How do I see the SQL with bindings in Laravel?
Call toRawSql() on a query builder to get the SQL with its bindings filled in, or ddRawSql() to dump it and stop. In Gaze, ->gaze() on a query builder shows the same before the query runs.
When can I use Gaze?
Gaze is free and coming soon for Mac, Windows and Linux. Get launch news from the Gaze page and we will email you the day it is out.
Sources: Laravel: Listening for query events · Laravel: Monitoring cumulative query time · Laravel: Debugging queries · Laravel: once()
Every query, under the request that ran it
Gaze is a desktop debugger for PHP, Laravel and JavaScript. Every dump, query, log and exception lands in one window, grouped by the request that caused it, with N+1 and slow queries flagged for you. It is free and coming soon for Mac, Windows and Linux. Get launch news and we will email you the day it is out.
Get launch news See Gaze, the free desktop debugger for Laravel